Solution
Reports built on the numbers your registers write
Sales, stock and accounting live in one system, so your reports line up without an export, a sync or a spreadsheet.
app.retaileros.ai/reports/sales
Retail analytics, defined
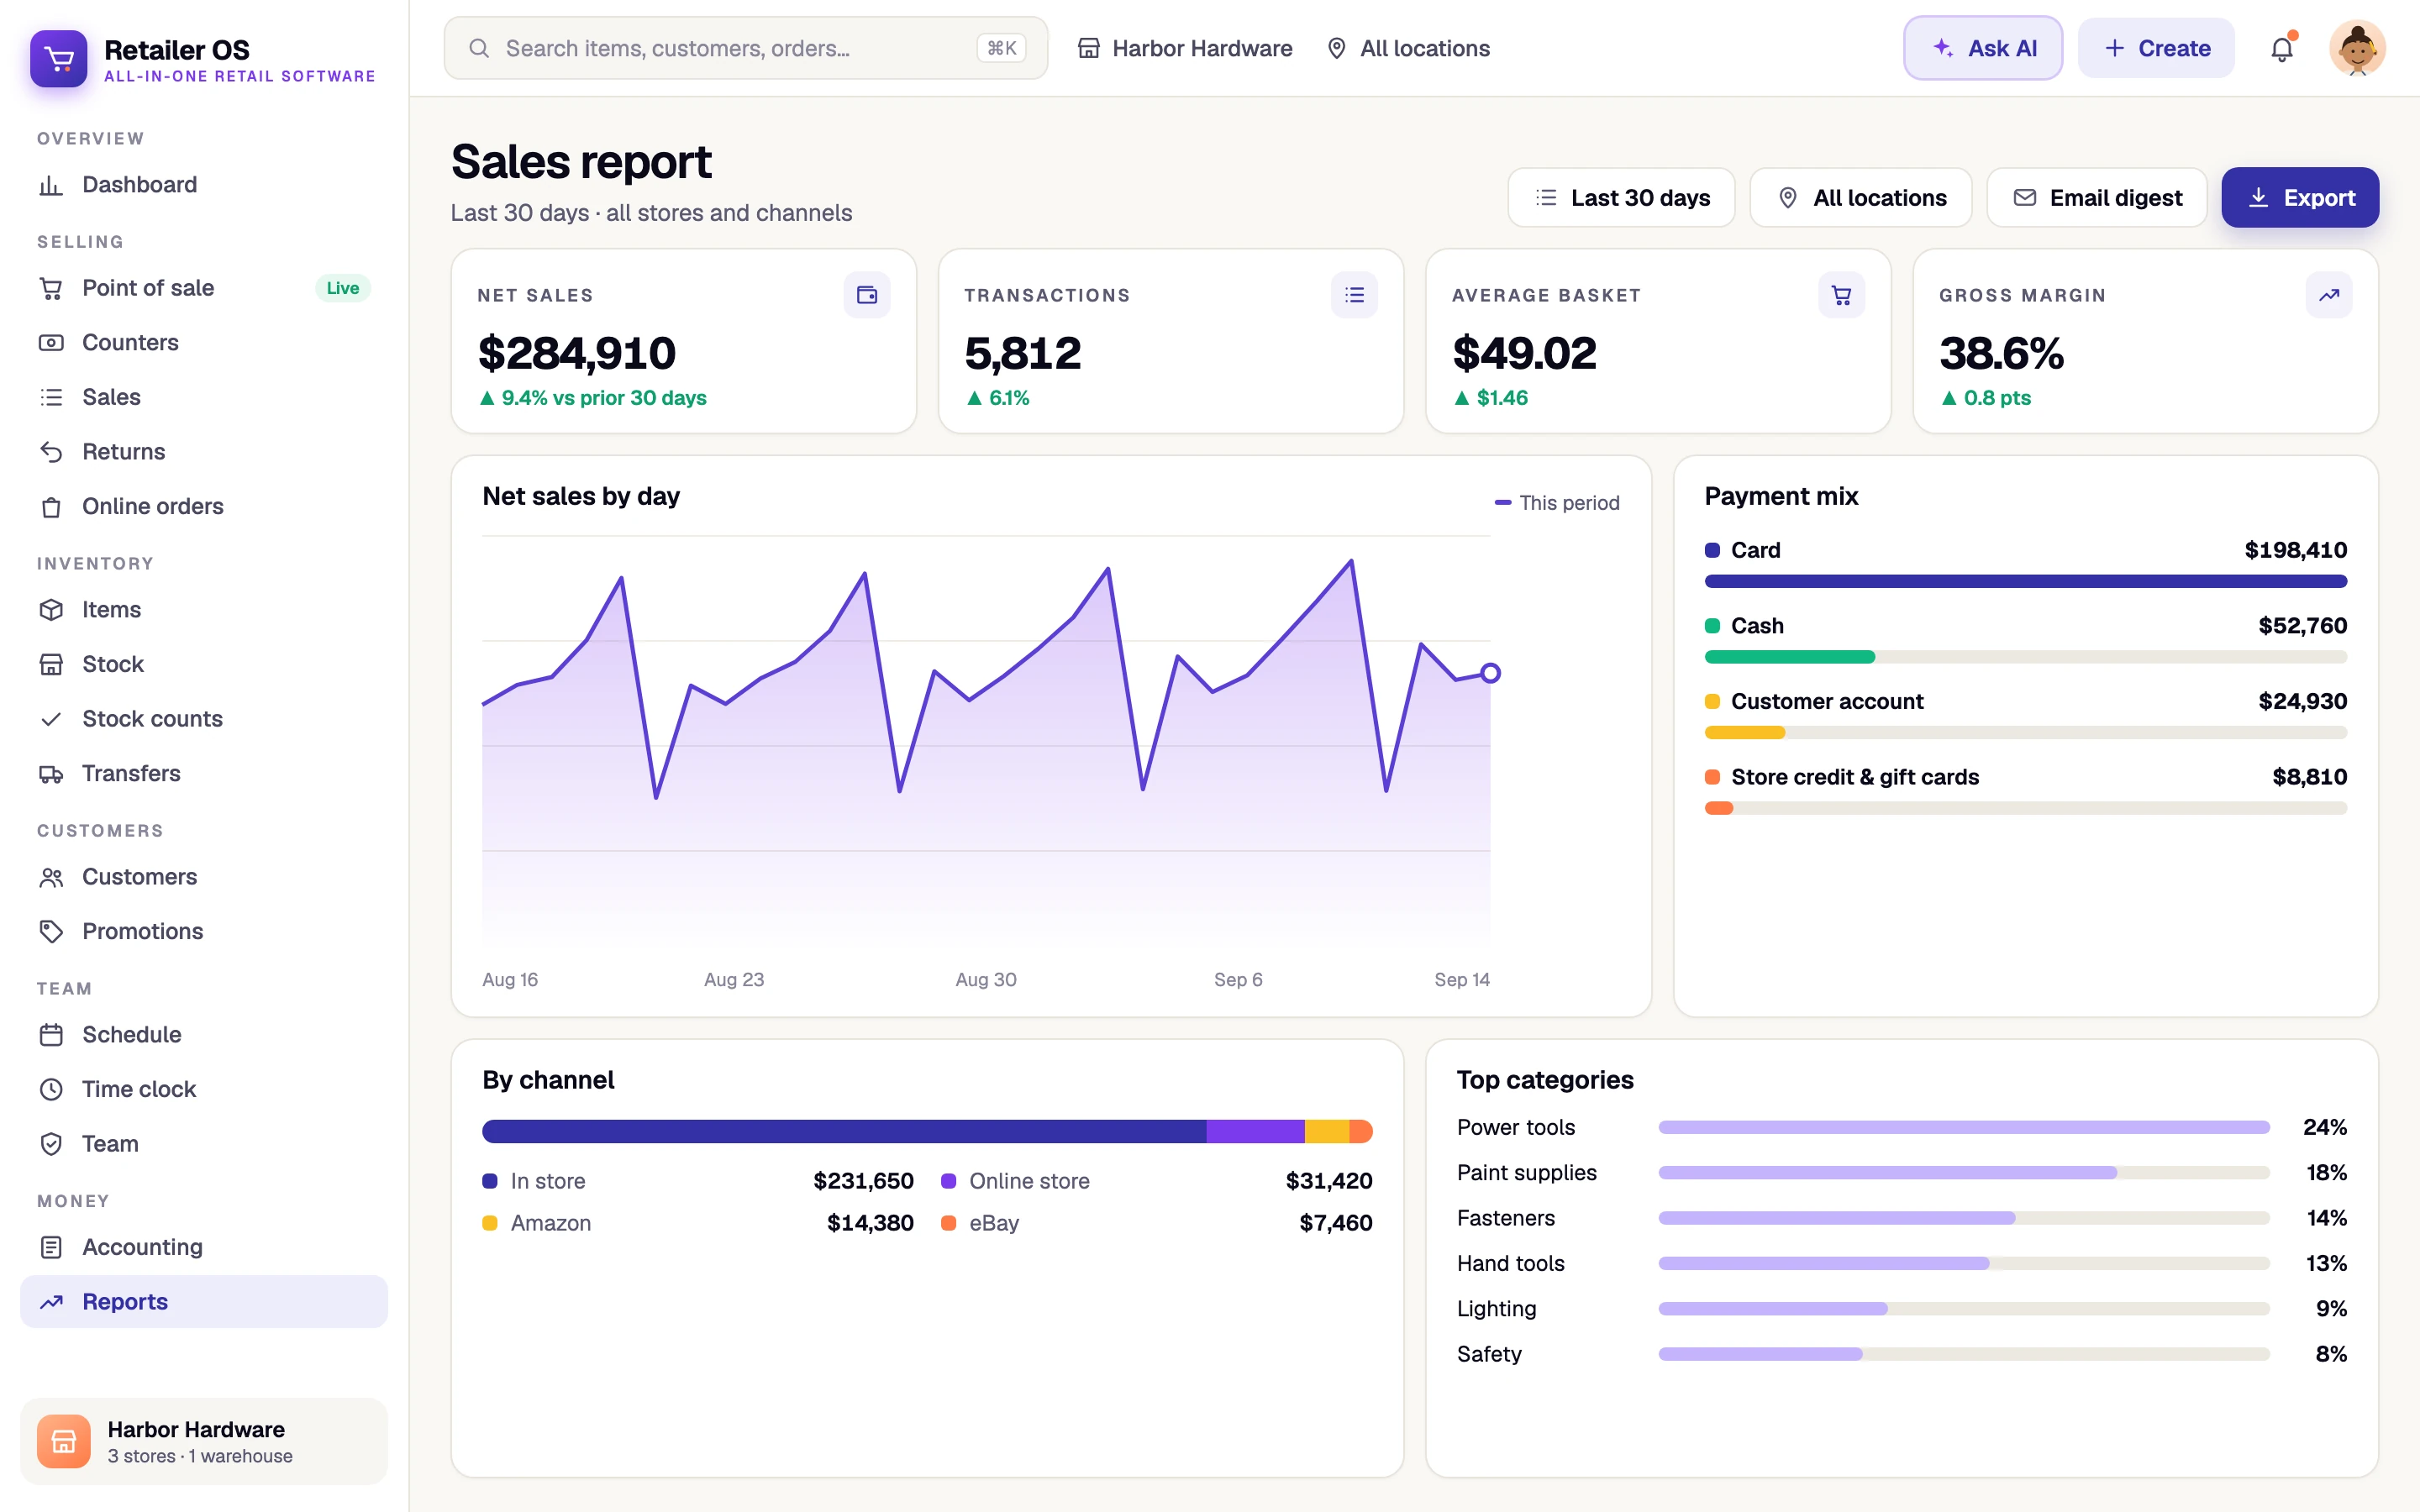
Retail analytics is using sales, inventory and staff data to decide what to buy, stock, price and staff. Retailer OS reports straight from the ledger its registers, inventory and books share (sales, margin, inventory valuation, dead stock, top products, cashier performance and more) and can email the numbers to you on a schedule.
The problem
What gets in the way today
- Reports come from three systems that never match
- Margin gets worked out by hand in a spreadsheet
- Dead stock sits on shelves because nobody runs the report
- The owner has to log in to find out how yesterday went
- Nobody knows which hours are actually busiest
Capabilities
Retail analytics in Retailer OS
Sales and margin
Sales, daily, channel, top products and payment mix reports, filtered by location.
Inventory and vendors
Inventory valuation, dead stock and vendor performance, from the same ledger the register uses.
Team and traffic
Cashier performance and an hourly heatmap of when sales happen.
Digests and AI insight
Daily, weekly or monthly email digests. With an AI plan (from $19.99/month), a daily insight and Ask AI for plain-English questions.
How it works
Step by step in Retailer OS
- 01
Sell and receive as usual
Every sale, return, receipt and transfer lands in the ledger.
- 02
Open the report you need
Pick the report and filter it by period and location.
- 03
Schedule a digest
Get the numbers you care about by email daily, weekly or monthly.
- 04
Ask a follow-up
On an AI plan (from $19.99/month), ask a question in plain English and get an answer from your store data.
Outcomes by role
Who it helps, and how
Owners
Yesterday’s numbers in the inbox, plus a roll-up across every store account they own.
Store managers
Top products, dead stock and busy hours for their location.
Bookkeepers
A/R aging and daily sales figures that match what’s sent to QuickBooks Online.
Related
Explore more of the platform
FAQ
Common questions
Last updated September 14, 2026
Run every store from one system.
Point of sale, inventory, and your team in one place. Start a 14-day free trial with no card required, or book a walkthrough with our team.